
Particle Size Matters: The IMS–Newpark Cedar-Fibre LCM Test
Part 3 of 8 — Drilling Fluid Monitoring: From Measurements to Decisions
At Newpark’s Beeville LMP site in Texas, USA, IMS and Newpark tested RheoSense with drilling fluid containing cedar-fibre lost circulation material (LCM). The test combined photographs of the mixture and operating displays with a recorded rheology profile. [1, 2]
The photographs document RheoSense circulating the test fluid at stages through a nominal cedar-fibre loading of 7.7 lb/bbl (22.0 kg/m³). The logger recorded pronounced changes in the low-shear outputs during the test. These observations provide practical insight into handling this mixture and interpreting the measurements. [1, 2]
Article 2 explored fluid changes between manual checks. Here, the IMS–Newpark test brings particle handling and the recorded rheology response into focus.
The cedar-fibre mixture
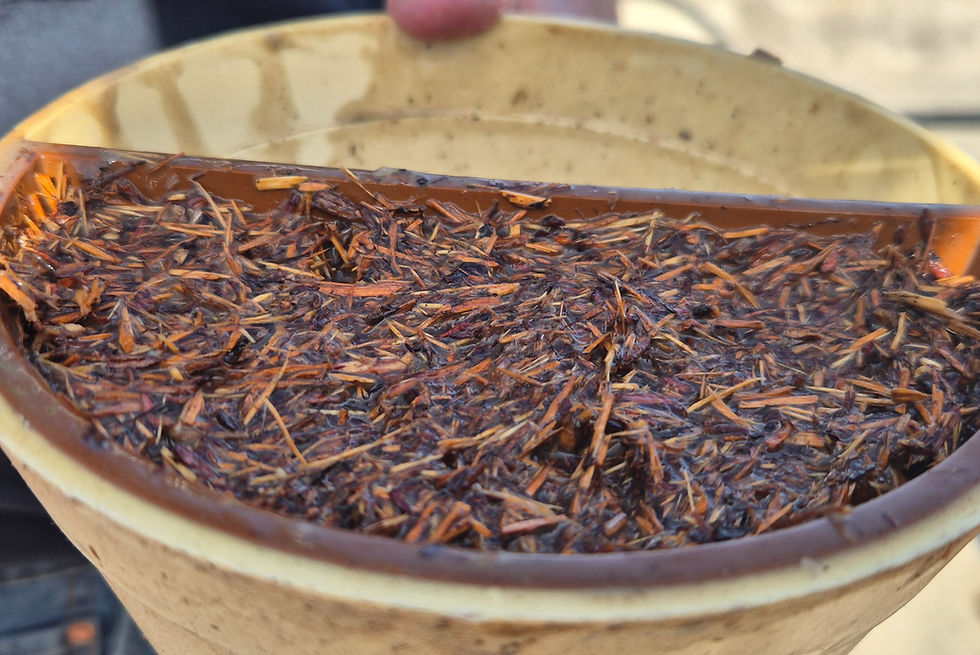
The Beeville sample photographs show fibres and chips with varied shapes and dimensions. A sample taken from the RheoSense mud sample point at the nominal 3.9 lb/bbl (11.1 kg/m³) stage is shown below. The tape gives a visual scale, while the annotated image identifies selected pieces for closer inspection. [1]


Five photographed loading stages
The five photographed stages below are labelled from 1.3 to 7.7 lb/bbl (3.7 to 22.0 kg/m³) nominal cedar fibre. Material retained on the Marsh funnel screen makes the fibres visible. The loading values come from the test labels; the photographs do not measure concentration or establish a representative size distribution. [1]


RheoSense operating with the fibre-rich mud
At the photographed 7.7 lb/bbl (22.0 kg/m³) stage, the RheoSense display records approximately 56.6 L/min (15.0 US gal/min) flow and 1.447 bar (21.0 psi) pump pressure. The needles are in the display’s green zones at that moment. This supports circulation with the documented mixture and setup; it does not establish measurement accuracy. [1]

Rheology changes recorded during the test
IMS confirms that the early increase across all displayed rpm curves occurred while viscosifier was being mixed into the fluid. From the early to the intermediate comparison window, for example, the median 3 rpm output increased from 1.74 to 4.15, while the 600 rpm output rose from 24.10 to 27.42. The chart highlights this mixing stage in both the higher- and lower-shear panels. [1, 2]
Following the early rise, the recorded outputs declined. In selected intermediate and later comparison windows, the median 3 rpm dial-equivalent output fell from 4.15 to 0.33 (about 92%), and the 6 rpm output from 4.38 to 0.57 (about 87%). The 600 rpm output fell from 27.42 to 22.79 (about 17%). The higher-shear output alone would therefore give an incomplete picture of the relative changes in the reported profile. [2]

These are RheoSense outputs expressed on a Fann-style dial-equivalent scale, not independent Fann 35 measurements. The percentages compare medians from screened data within the selected windows. The chart includes a broader set of validity-flagged records, including transients and held values, and ends before later operating transitions. [2]
IMS’ confirmation identifies viscosifier mixing as the activity accompanying the early increase. Exact addition times and a complete timestamped LCM addition log are still needed to align the later changes with individual loading stages. Matched reference measurements are needed to assess measurement accuracy. [1, 2]
Lessons from the IMS–Newpark test
The Beeville test highlights two parts of an LCM monitoring evaluation: delivering the mixture to the instrument and understanding the resulting measurement record. The supply outlet, connections, pump, valves, measuring sections and return line all form part of that assessment.
RheoSense derives rheological properties from measured flow rate and pressure drop through pipe sections in a closed loop. IMS specifies particle handling up to 6 mm (0.236 in), subject to the fluid and installation. The photographed fibres do not establish a different particle-size rating; suitability depends on the actual mixture and complete fluid path. [3]
Manual Fann 35 measurements remain useful reference checks when the geometry and procedure suit the fluid. Use the same fluid source, align sampling time and test conditions, and record temperature, mixing and preparation.
If coarse material is removed before testing, the result describes the prepared sample. Record that treatment when comparing it with measurements of the circulating mixture.
For the next application, start with the planned fluid formulation, LCM shape and size distribution, loading range, operating temperatures and connection arrangement. Agree the reference-test procedure and acceptance criteria before testing. This turns observations such as those from Beeville into a defined evaluation for the intended operation.
Contact IMS to discuss a monitoring and qualification plan for your fluid and LCM programme.
Closing perspective: published research
Published work provides useful context for the IMS–Newpark observations. Kulkarni, Savari and Fowler found that changing the size distribution of granular LCM at constant loading changed the measured rheological response. Their study also examined wider rotor–bob combinations for coarse materials. These findings relate to the fluids and conditions they studied. [5]
Fann’s documentation likewise shows why the chosen measuring geometry matters: the standard R1/B1 radial gap is approximately 1.17 mm (0.046 in), with wider combinations available. [4] These sources help frame the measurement questions; the evidence presented here comes from the IMS–Newpark Beeville test and remains specific to its documented fluid, setup and records.
References
[1] IMS / Newpark. Newpark Beeville LMP site test, Beeville, Texas, USA, 2025. Internal source presentation: photographs, loading labels, operating display and supply-restriction notes. Sampling location and the early increase during viscosifier mixing across all displayed rheology curves confirmed by IMS.
[2] IMS / Newpark. Beeville logger archive, 8–10 December 2025. Main record: CurrentLog0.csv, 10 December 2025. Internal selected-window analysis and charts prepared 8 October 2026. Elapsed time is used because the logger timezone is unconfirmed.
[3] Intelligent Mud Solutions. Fann 35 and RheoSense, Spot Measurements and Automated Fluid Monitoring. Article 1 in this series.
[4] Fann Instrument Company. Model 35 Viscometer Instruction Manual, No. 208878, Revision P, January 2016. Tables 3-3 and 3-4.
[5] Kulkarni, S. D., Savari, S. and Fowler, D. Predicting Rheology of Drilling Fluids Containing Large Sized LCMs. AADE-16-FTCE-67, 2016.


Comments